
Where the World's Migrants Live 304 million, and a share that barely moved
In 2024, about 304 million people live in a country other than the one they were born in. That number has nearly doubled since 1990, yet migrants' share of the world's population has only moved from 2.9% to 3.7%. This page shows why both sentences are true, then asks you to guess.
- million international migrants, mid-2024
- 304
- of the world's population
- 3.7%
- are women
- 48%

Fill your passport: every interactive section gives you a stamp.
Data: UN DESA Population Division, International Migrant Stock 2024. All figures are for 1 July of each year.
The apparent paradox
Doubled, yet still fewer than 4 in 100 people
Both charts start at zero. Drag the timeline and watch the two numbers move side by side.
From 154 million to 304 million: almost twice as many.
From 2.9% to 3.7%: slow and steady.
Why both are true
The world's population grew over the same years, from 5.3 to 8.2 billion. When the numerator and the denominator both grow, the ratio moves slowly. So "migration is exploding" does not fit the data: what grew fast is the absolute size, not the share.
One hundred people
If the world were 100 people
Each figure is one percent of the population. Pick a country and see how many of every hundred residents were born somewhere else.
In World, about 4 in every 100 people are migrants.
Shares are rounded. Where a country counts citizenship (code C), the figure means residents holding a foreign citizenship.
Where they live
Half of the world's migrants live in Europe and North America
The 304 million split by region of destination. Each band's width is that region's share of all the world's migrants.
- Europe and Northern America155.3 million · 13.7% of the region's population51.1%
- Northern Africa and Western Asia54.1 million · 9.3% of the region's population17.8%
- Sub-Saharan Africa24.3 million · 2.0% of the region's population8.0%
- Eastern and South-Eastern Asia22.6 million · 1.0% of the region's population7.4%
- Central and Southern Asia20.4 million · 0.9% of the region's population6.7%
- Latin America and the Caribbean17.5 million · 2.6% of the region's population5.8%
- Australia and New Zealand9.6 million · 30.0% of the region's population3.2%
- Rest of Oceania322 thousand · 2.3% of the region's population0.1%
High-income countries host 65.5% of the world's migrants.
One dataset, two rankings
Change the measure and the list turns over
Sort by number and the large, rich countries rise to the top. Sort by share of population and the list changes. Neither is wrong; they answer two different questions.
- 1United States52.4M · 15.2%
- 2Germany16.8M · 19.8%
- 3Saudi Arabia13.7M · 40.3%
- 4United Kingdom11.8M · 17.1%
- 5France9.2M · 13.8%
- 6Spain8.9M · 18.5%
- 7Canada8.8M · 22.2%
- 8United Arab Emirates8.2M · 74.0%
- 9Australia8.1M · 30.4%
- 10Russia7.6M · 5.3%
- 11Türkiye7.1M · 8.1%
- 12Italy6.6M · 11.0%
The share ranking includes only countries and areas with more than 100,000 migrants. The United States, first by number, is 33rd here.
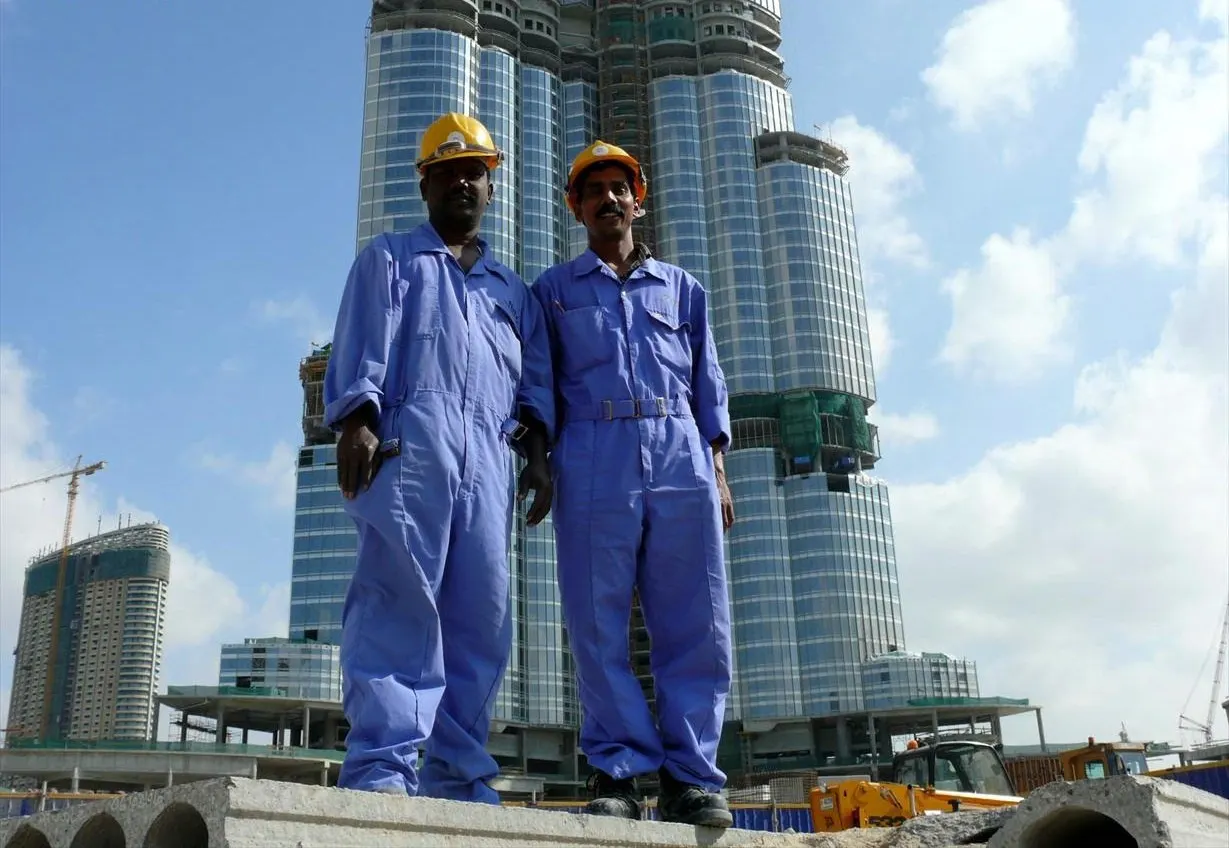
A high share is not always a "country of immigration"
In the Gulf states, most migrants are temporary contract workers whose residence is tied to an employer sponsor (kafala). Naturalisation exists in law but is discretionary, capped or very rare, so in practice there is no general route to citizenship. That is structurally different from Canada or Australia, which offer permanent residence and citizenship. The same percentage does not mean the same thing.
Find your country
233 countries and areas, one search
Type a country. You get the 2024 figure, the trend since 1990, the share of women, and what exactly the UN counted.
Canada
#7 by number#23 by share- Migrants, 2024
- 8.8 million
- 8,805,839
- Share of population
- 22.2%
- Women
- 52.6%
- Change since 1990
- +107%
Two close-ups
Iran and Canada
Iran: a U-shaped curve
 Iran: a U-shaped curve
In 1990 about 4.3 million migrants lived in Iran, 7.4% of the population. By 2000 the figure had fallen to 2.5 million, then it rose again: 3.8 million in 2024, or 4.2% of the population.
Between 2020 and 2024 it grew by more than one million, the sixth-largest increase in the world over those four years.
Iran's figure counts foreign citizens (code C), not place of birth, and includes refugees (code R). This file does not say where these people came from.
For context: UNHCR counted about 3.5 million refugees in Iran at the end of 2024, almost all of them Afghans, which makes Iran the largest refugee host in the world. Iran's government had estimated more than a million new arrivals after August 2021.
Canada: doubled, with a path to citizenship
From 4.3 million in 1990 to 8.8 million in 2024. As a share of the population, from 15.3% to 22.2%: about two in every nine residents were born elsewhere.
7th in the world by number, and 23rd by share among countries with more than 100,000 migrants.
Canada's figure counts the foreign-born (code B), temporary students and workers included. Permanent residents can apply for citizenship after three years of physical presence within five, which is the difference the Gulf section points to.
Women and men
An average of 48%, a range from 20 to 70
Worldwide, close to half of all migrants are women. The average hides very large differences between destinations. Hover or tap a dot to see its figure.
Domestic-work routes are mostly female, construction routes mostly male. The gender split mirrors the sector that draws migrants in.

The game
Guess first, then look
Four levels. You guess, then you see the real number. Guessing before seeing the answer, even guessing wrong, makes learning stick better. This is called the pretesting effect.
Rank
Rookie
Before you quote
Before you quote these numbers
This is a stock, not a flow
Each year's figure is the number of people living in a country who were born elsewhere, not the number who moved that year. The change from 2020 to 2024 is not "arrivals" either: deaths, returns and naturalisation are in it too.
Countries don't all count the same thing
180 countries and areas count the foreign-born (code B). 48, including Iran and the Gulf states, count foreign citizens (code C). Someone born in a country without its citizenship is a migrant in the second group. Comparing the two groups directly is not exact.
Refugees are in most figures
Code R means refugees and asylum seekers were added to the estimate, in 159 countries and areas. For Jordan, Türkiye and Iran this is a large part of the figure. It is a method choice, not an error, but it changes what the number means.
A high share is not always a "country of immigration"
In the Gulf a high share is mostly temporary labour. Canada and Australia offer permanent residence. The same percentage does not mean the same thing.
Method and sources
How this report was made
- Every figure is taken directly from Tables 1–4 of the UN file (International Migrant Stock 2024: Destination): 233 countries and areas, eight years from 1990 to 2024.
- The reference date is 1 July. An "international migrant" is someone living outside their country of birth or, where birthplace data are missing, a foreign citizen.
- The share ranking includes only countries and areas with at least 100,000 migrants, so very small places do not fill the list.
- Your game progress and passport are stored only in your own browser and are not sent anywhere.
Sources
- UN DESA Population Division (2024). International Migrant Stock 2024. POP/DB/MIG/Stock/Rev.2024 (CC BY 3.0 IGO)
- UN DESA (2025). International Migrant Stock 2024: Key facts and figures
- Richland, Kornell & Kao (2009). The pretesting effect. Journal of Experimental Psychology: Applied 15(3)
- UNHCR Refugee Data Finder: refugees hosted by Iran, end-2024